library(sf)
library(ggplot2)
# 数据来源 http://datav.aliyun.com/portal/school/atlas/area_selector
# 100000 为中国地图,500000 为重庆,510000 为四川......
adcode <- "100000"
# 读取数据,取所需内容
site <- paste0("https://geo.datav.aliyun.com/areas_v3/bound/",adcode,"_full.json")
df_map <- read_sf( site[1] )[,c('adcode','name','center','parent','geometry')]
n <- which(is.na(df_map[,4]) ) # 坐标缺失列
# 标签经、纬度坐标
df_map$jd <- NA
df_map[-n,'jd'] <- matrix(unlist(df_map$center[-n] ),ncol = 2, byrow = T)[,1]
df_map$wd <- NA
df_map[-n,'wd'] <- matrix(unlist(df_map$center[-n]),ncol = 2, byrow = T)[,2]
df_map$value <- 1:nrow(df_map) # 给各省赋值,可自行更改。
# 画图
p <- ggplot(data=df_map)+ geom_sf(aes(fill = value) ) +
fixed_plot_aspect(ratio = 1.25) +
labs(title='Map') +
# coord_sf(crs = 4326)
annotation_scale(location='bl')+ # 添加比例尺
# 添加指北针
annotation_north_arrow(location = "tl", which_north = "false", style = north_arrow_fancy_orienteering) +
# 数据列,低值、高值颜色
scale_fill_gradient(name ='value', low= 'white', high= 'red' )
p
# 背景(经纬度网格线)
p + geom_text(data = df_map,aes(x=jd,y=wd,label= name), position = "identity",size=3) +
theme( plot.title = element_text(hjust = 0.5,size=30 ) )
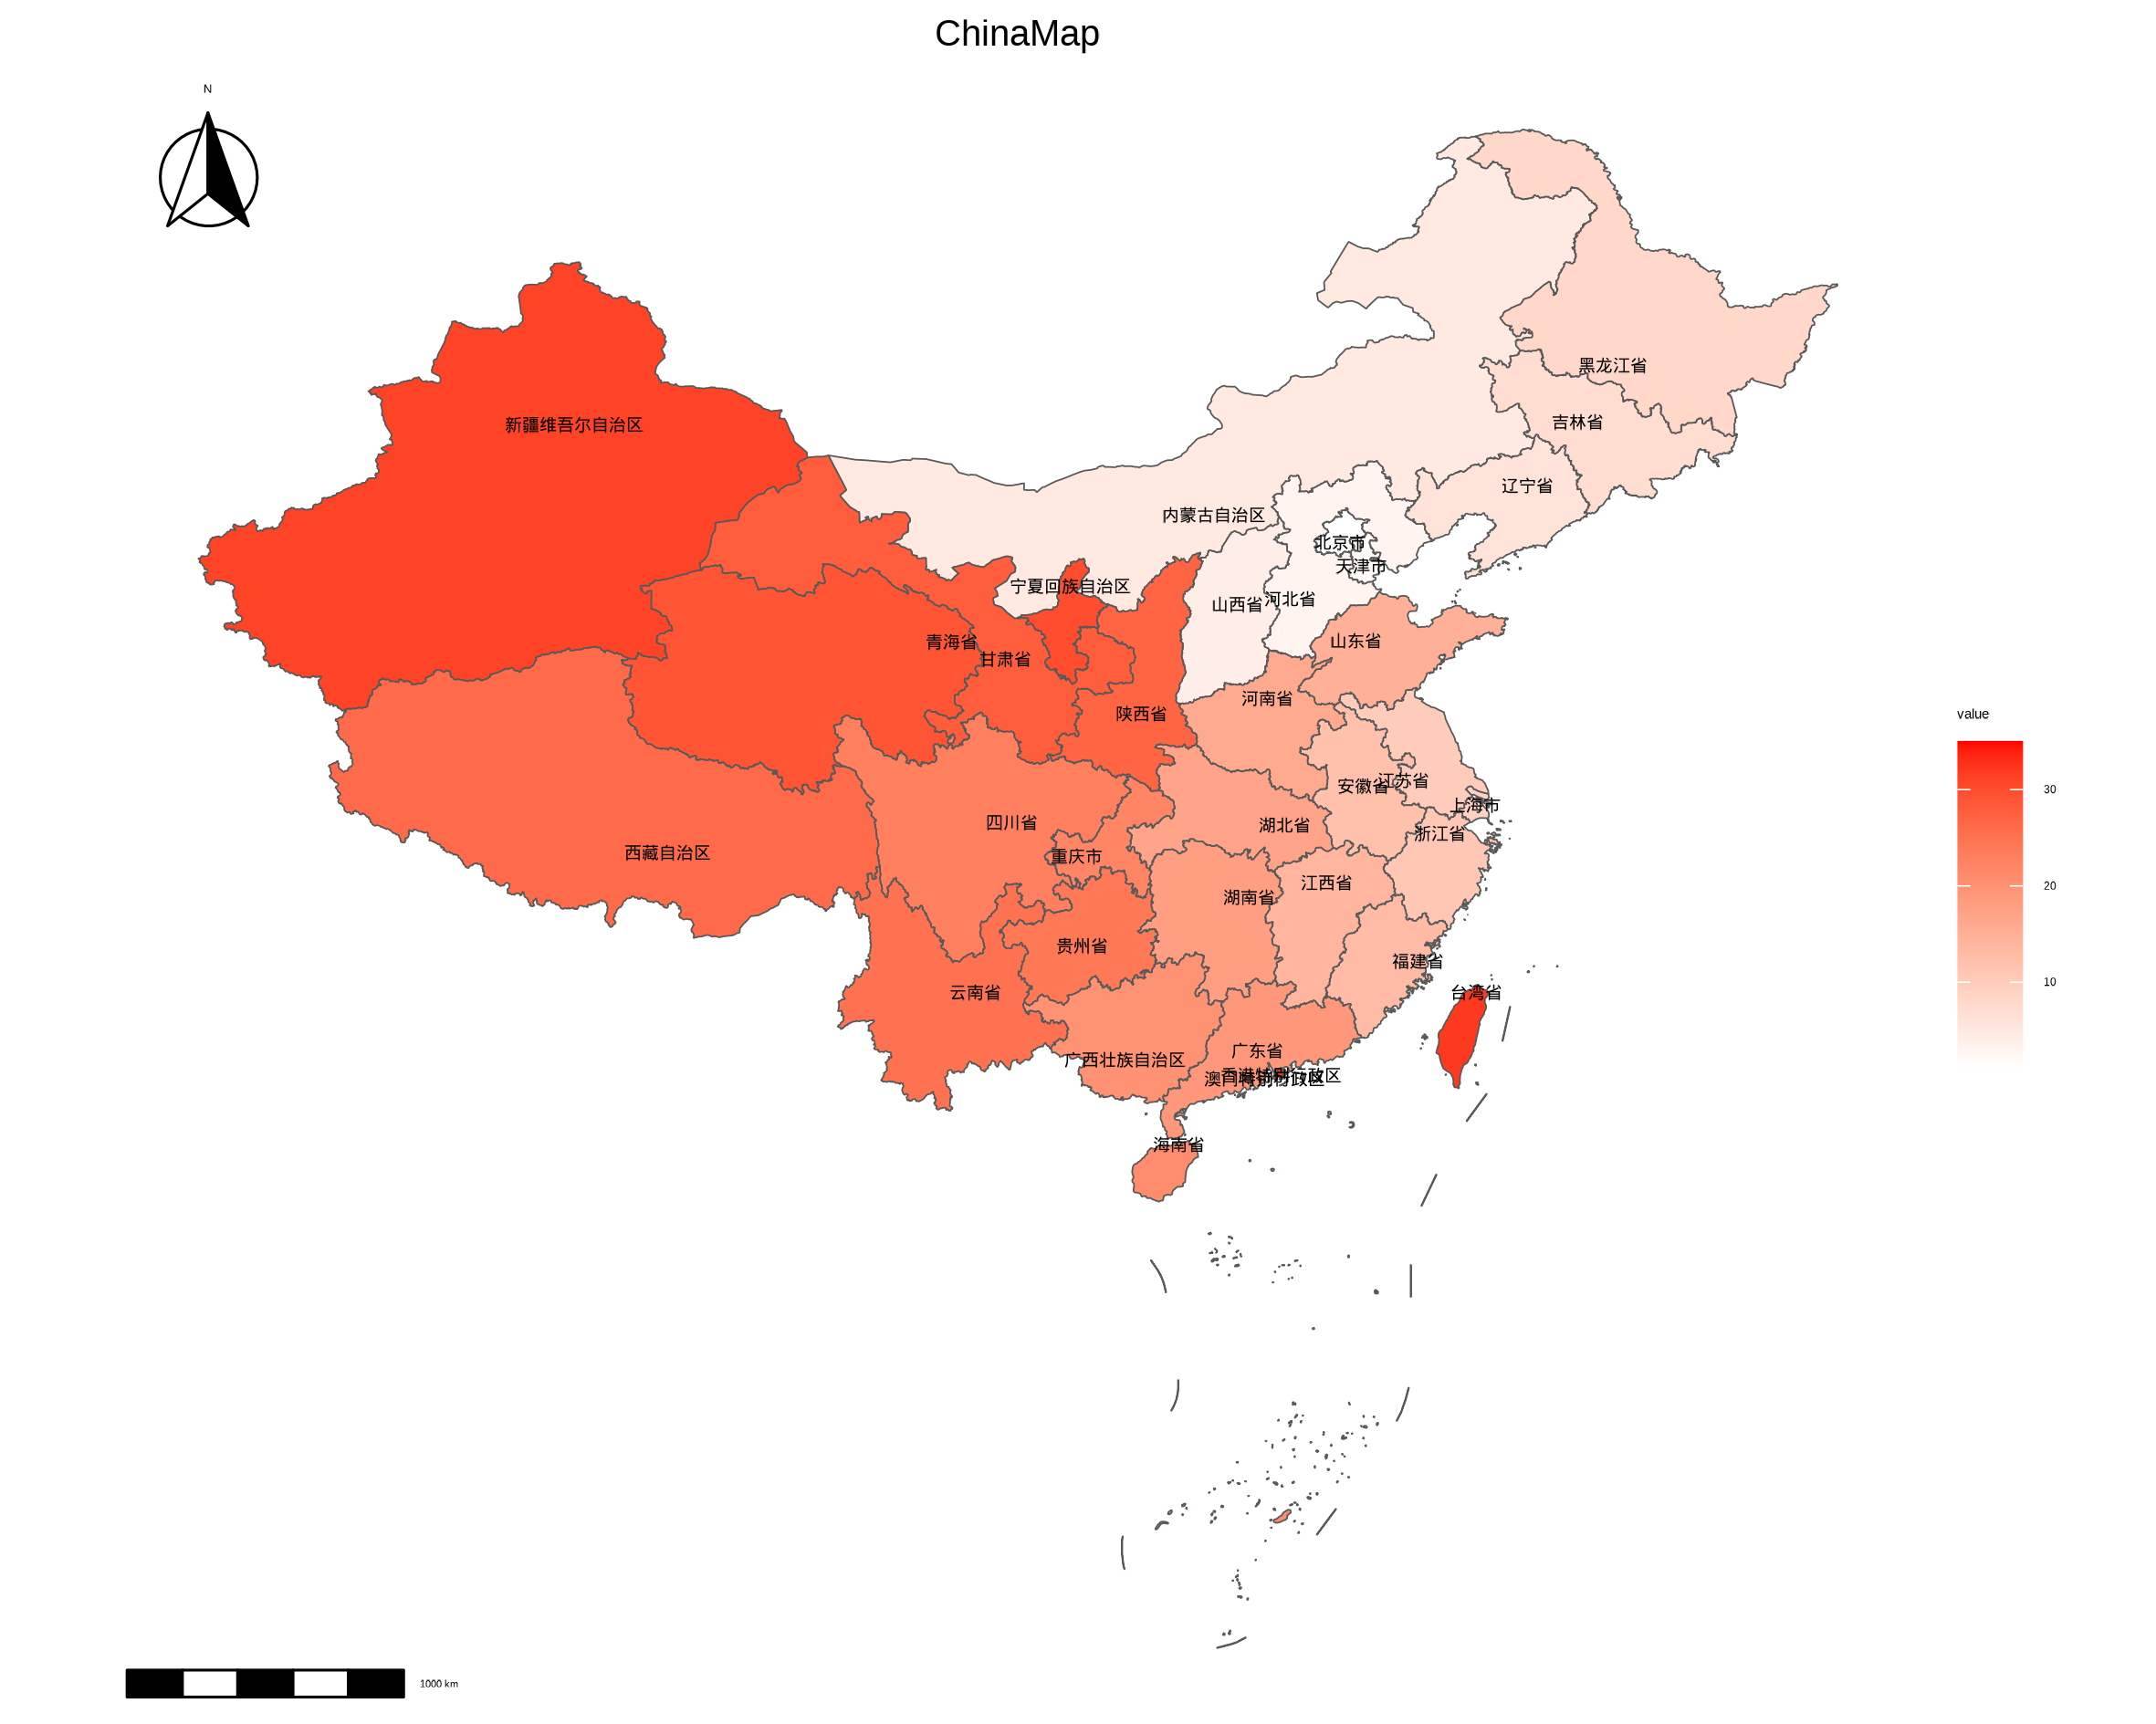
# 无背景
p + geom_text(data = df_map,aes(x=jd,y=wd,label= name), position = "identity",size=3) +
theme_void()+
theme( plot.title = element_text(hjust = 0.5,size=30 ) )
# 地图投影
p + theme( plot.title = element_text(hjust = 0.5,size=30 ) )+
# 投影
coord_sf(crs = "+proj=laea +lat_0=40 +lon_0=104")