## 构建数据
data(iris)
dat <- iris[,1:4]
dat <- na.omit(dat) # 去除缺失值
# 计算平均值(mean)与标准差(sd)
dat <- data.frame( var = colnames(dat),
mean = apply(dat, 2, mean ),
sd = apply(dat, 2, sd ) )
dat
# 画图
library(ggplot2)
library(ggsci)
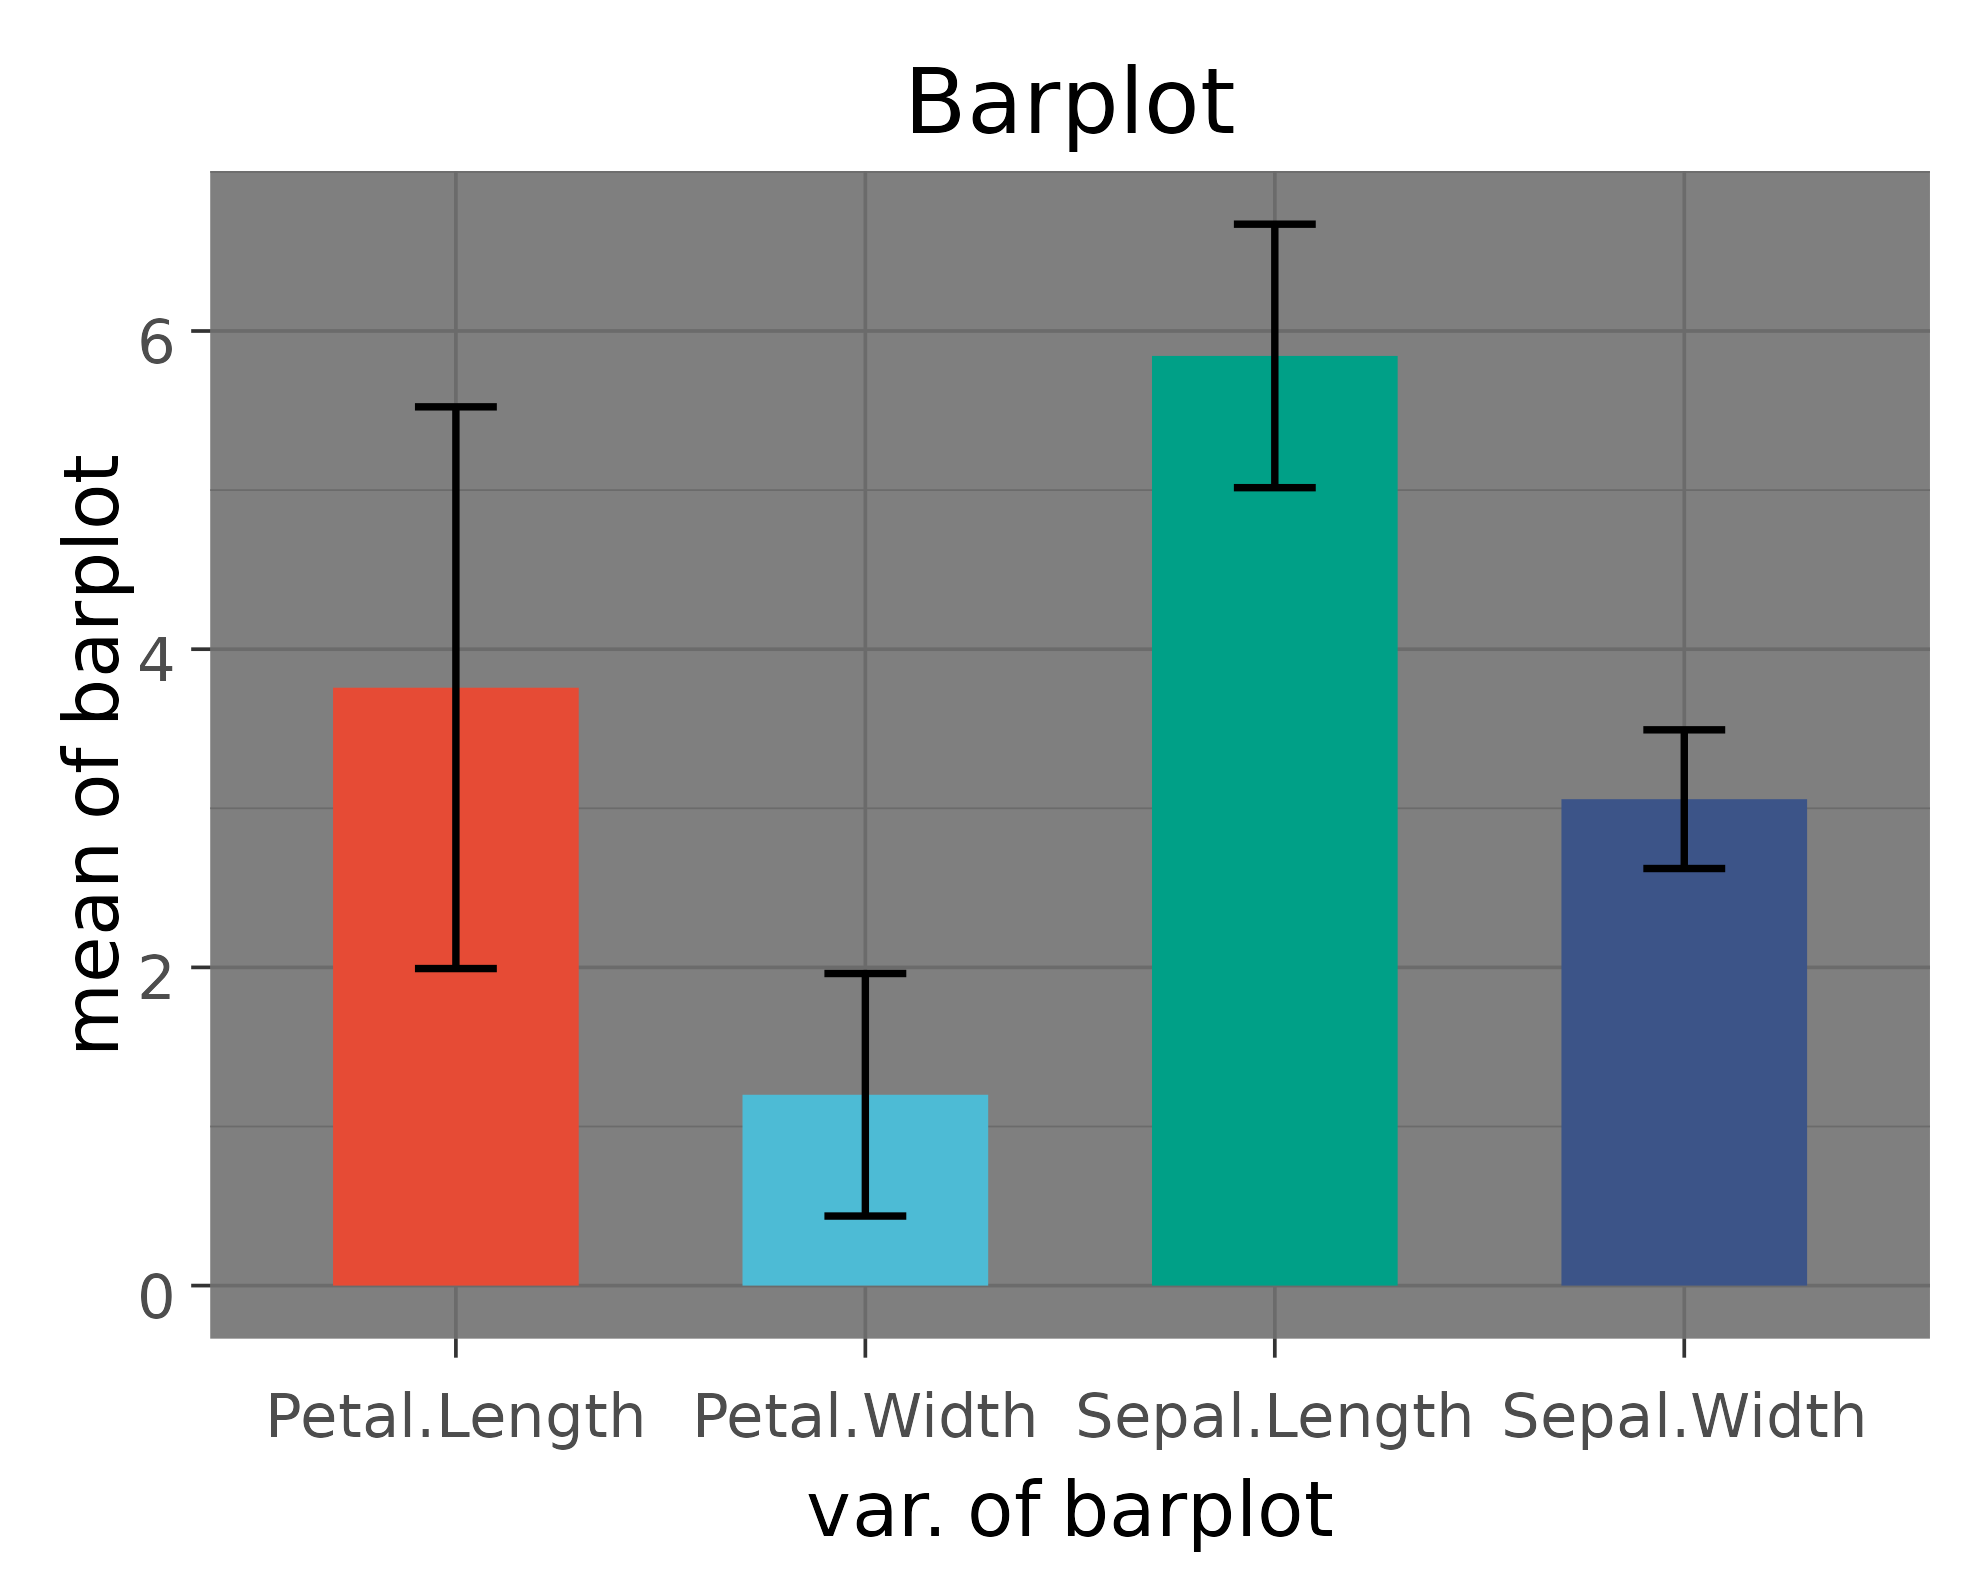
ggplot(dat,aes(x = var, y = mean, fill = var ) ) +
geom_bar(stat = "identity",
position = position_dodge(),
width = 0.6,
show.legend = F) +
geom_errorbar(aes(ymin = mean - sd,
ymax = mean + sd ),
width = 0.2,
color="black", # 误差线颜色
position=position_dodge(0.6) )+
# 配色选择
scale_fill_npg()+
# scale_fill_brewer(palette = "Greens",direction = -1) +
# scale_fill_grey( start=1, end=0 )+
# scale_fill_discrete()+
# scale_fill_aaas()+
# scale_fill_hue()+
# scale_fill_manual(values = heat.colors( nrow(dat) ))+
# scale_fill_manual(values = terrain.colors( nrow(dat) ))+
theme_dark()+ # 主题
labs(title="Barplot", x="var. of barplot", y="mean of barplot")+
theme(plot.title = element_text(hjust = 0.5))
# 保存数据
# ggsave(filename = 'barplot.png',width = 10, height = 8, units = 'cm',dpi = 500)